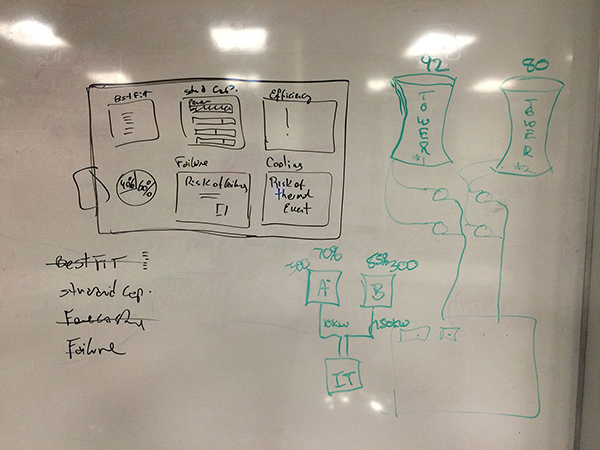
Wireframe
Materializing our curated data into a clickable wireframe seemed like the natural next step. This stage of the research helped us test our assumptions with early user feedback.
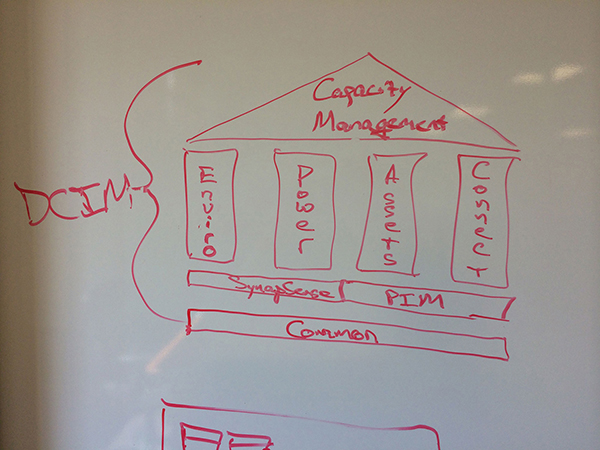
Key Industry Drivers
The 4 Pillars
Capacity Management best-practices includes data such as: Environment, Power, Assets, and Connectivity. These constituted the 4 pillars of any effective data center operation. Nobody in the industry was providing the right set of software features and tools to satisfy this level of mature operation. Our research gave us an in-depth view into the life of Data Center operators and managers, their struggles to make decisions early enough to prevent power outages and operation’s downtimes.
Brainstormming a Solution
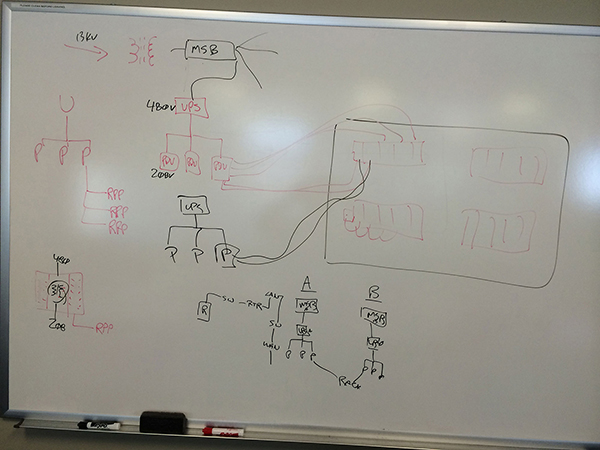
Power Chain
We were able to better understand and dissect, in detail, the different aspects of the Power Chain data. This is a key resource that affects all other operations in the data center, with dependencies at the server level, racks, PDUs and UPS units, switch boards, and redundant utility lines.
Brainstormming a Solution
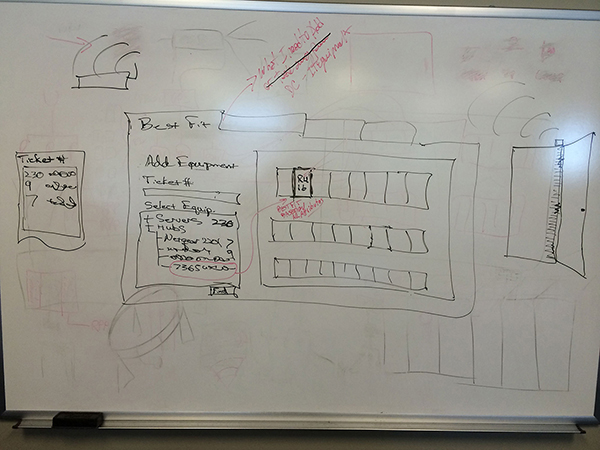
Best Fit Data
The UI design for this dataset required the inclusion of new algorithms. Complex computations from all available resources within the data center. This functionality helped users determine best equipment placement, based on business and operation processes, available resources, constraints, and management style.
Brainstormming a Solution
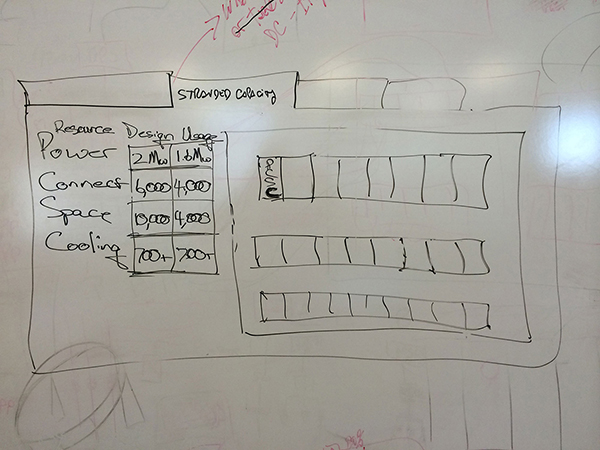
Stranded Capacity
This aspect of the UI design needed a different set of algorithms to compute and display the resource (connectivity, power, asset, environmental) responsible for stranding other available resources. One common use-case shows a rack with available space, power, and cooling capabilities, unable to receive new equipment, due to the maximization of connectivity outlets. That's how a maximized asset (connectivity) constraints all others.
Brainstormming a Solution
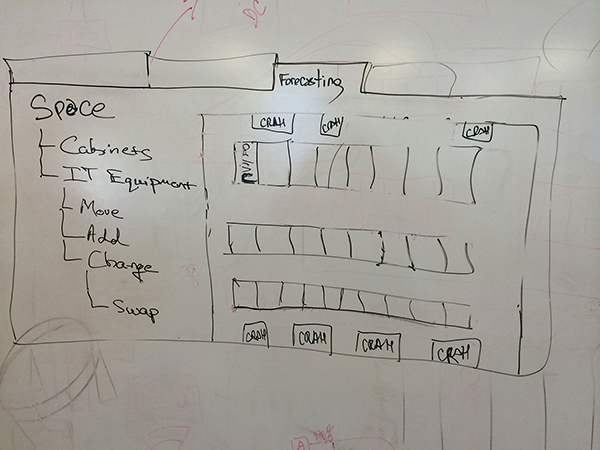
Forecasting
This tool was designed as a predictive feature. A common use-case shows that as companies acquire new customers, they need to expand internal capacity. Additional equipment can complicate effective operations by drawing extra loads of power and outputting more heat into the environment. These changes affect the efficiencies and resiliency of data center operations. The Forecasting tool automated these calculations to help users make more acurate, safe, and financially sound decisions.
Brainstormming a Solution
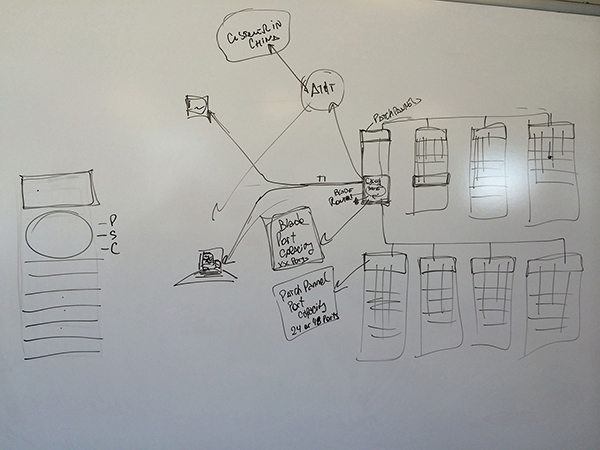
Failure Effect
This feature allows users to maintain a visual for all equipment inside the data center, including all chain connections and interdependencies. Users are able to check for incidental failures and adjacent effects of any equipment malfunction. This data is crucial for managers who need to build business-cases for budget approvals, increase resources, reduce costs, and prevent excessive over-provisioning.
Brainstormming a Solution
Cooling Chain
This design provides the user with the whole layer of interconnected assets, responsible for providing cooling to the data center. This data prevents equipment from heating-up beyond the stipulated manufacturer heat tolerances. Preventing equipment shutdowns and enabling a more transparent, reliant service to data center customers.