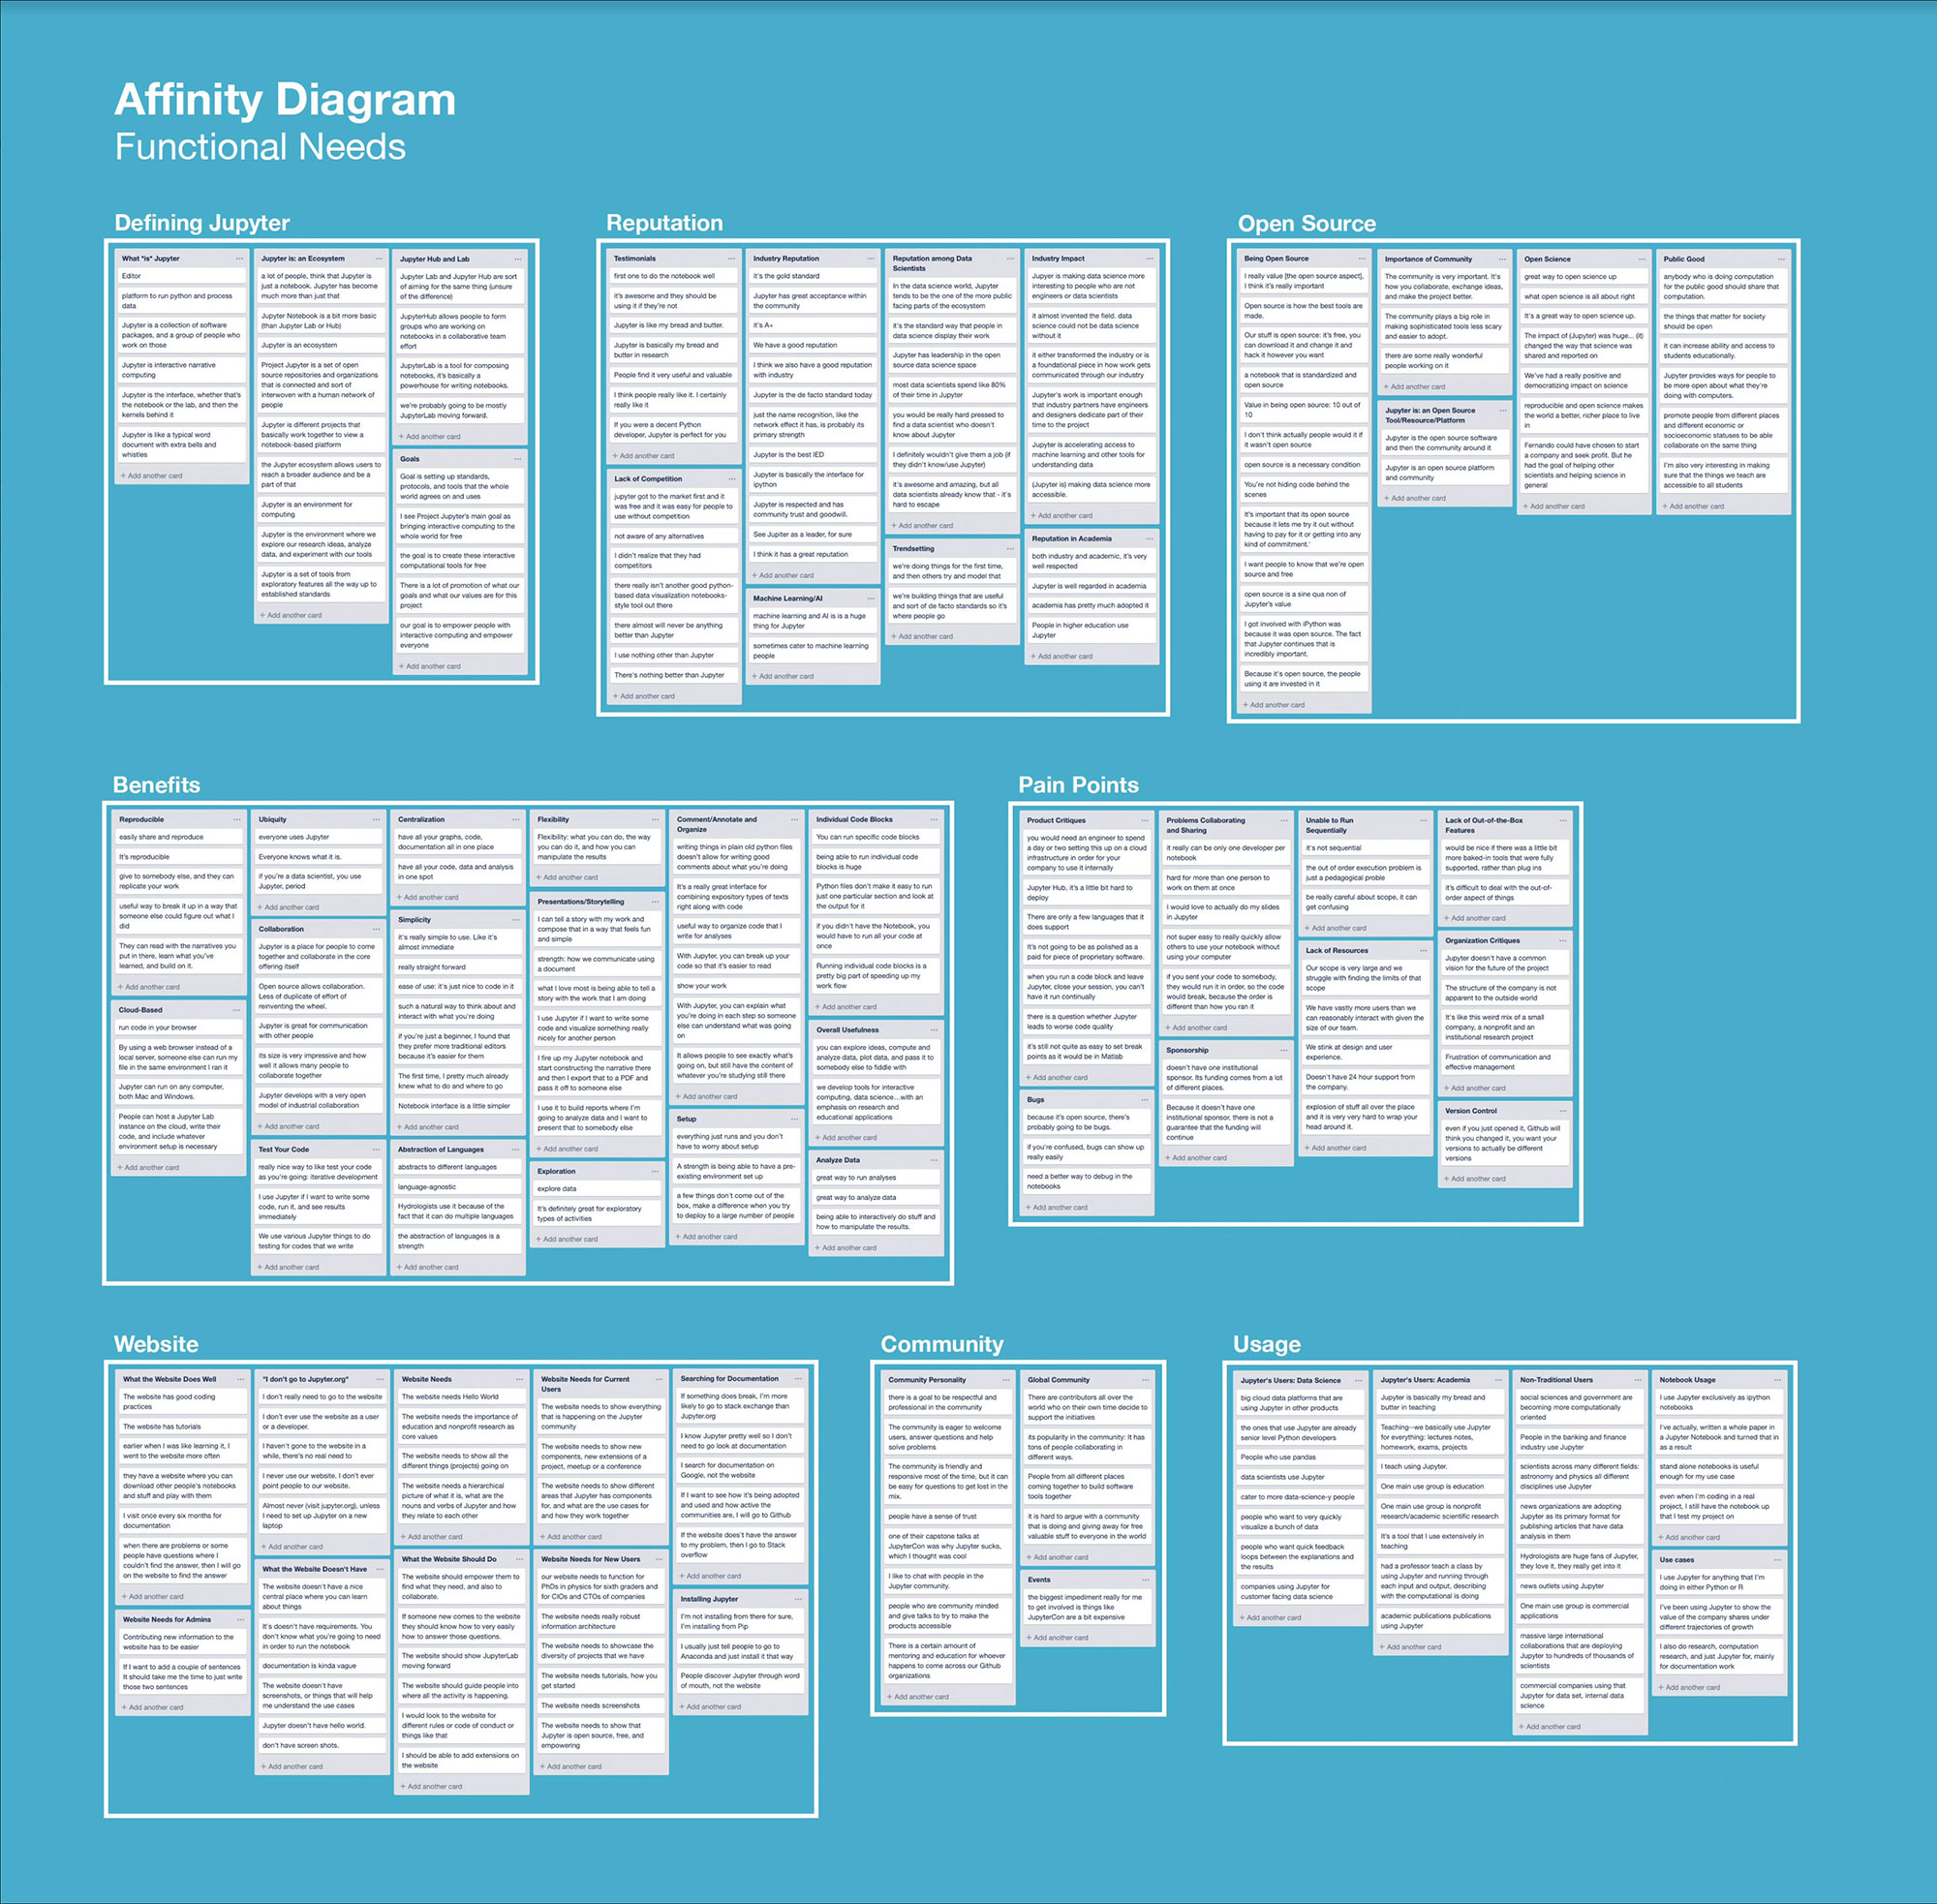
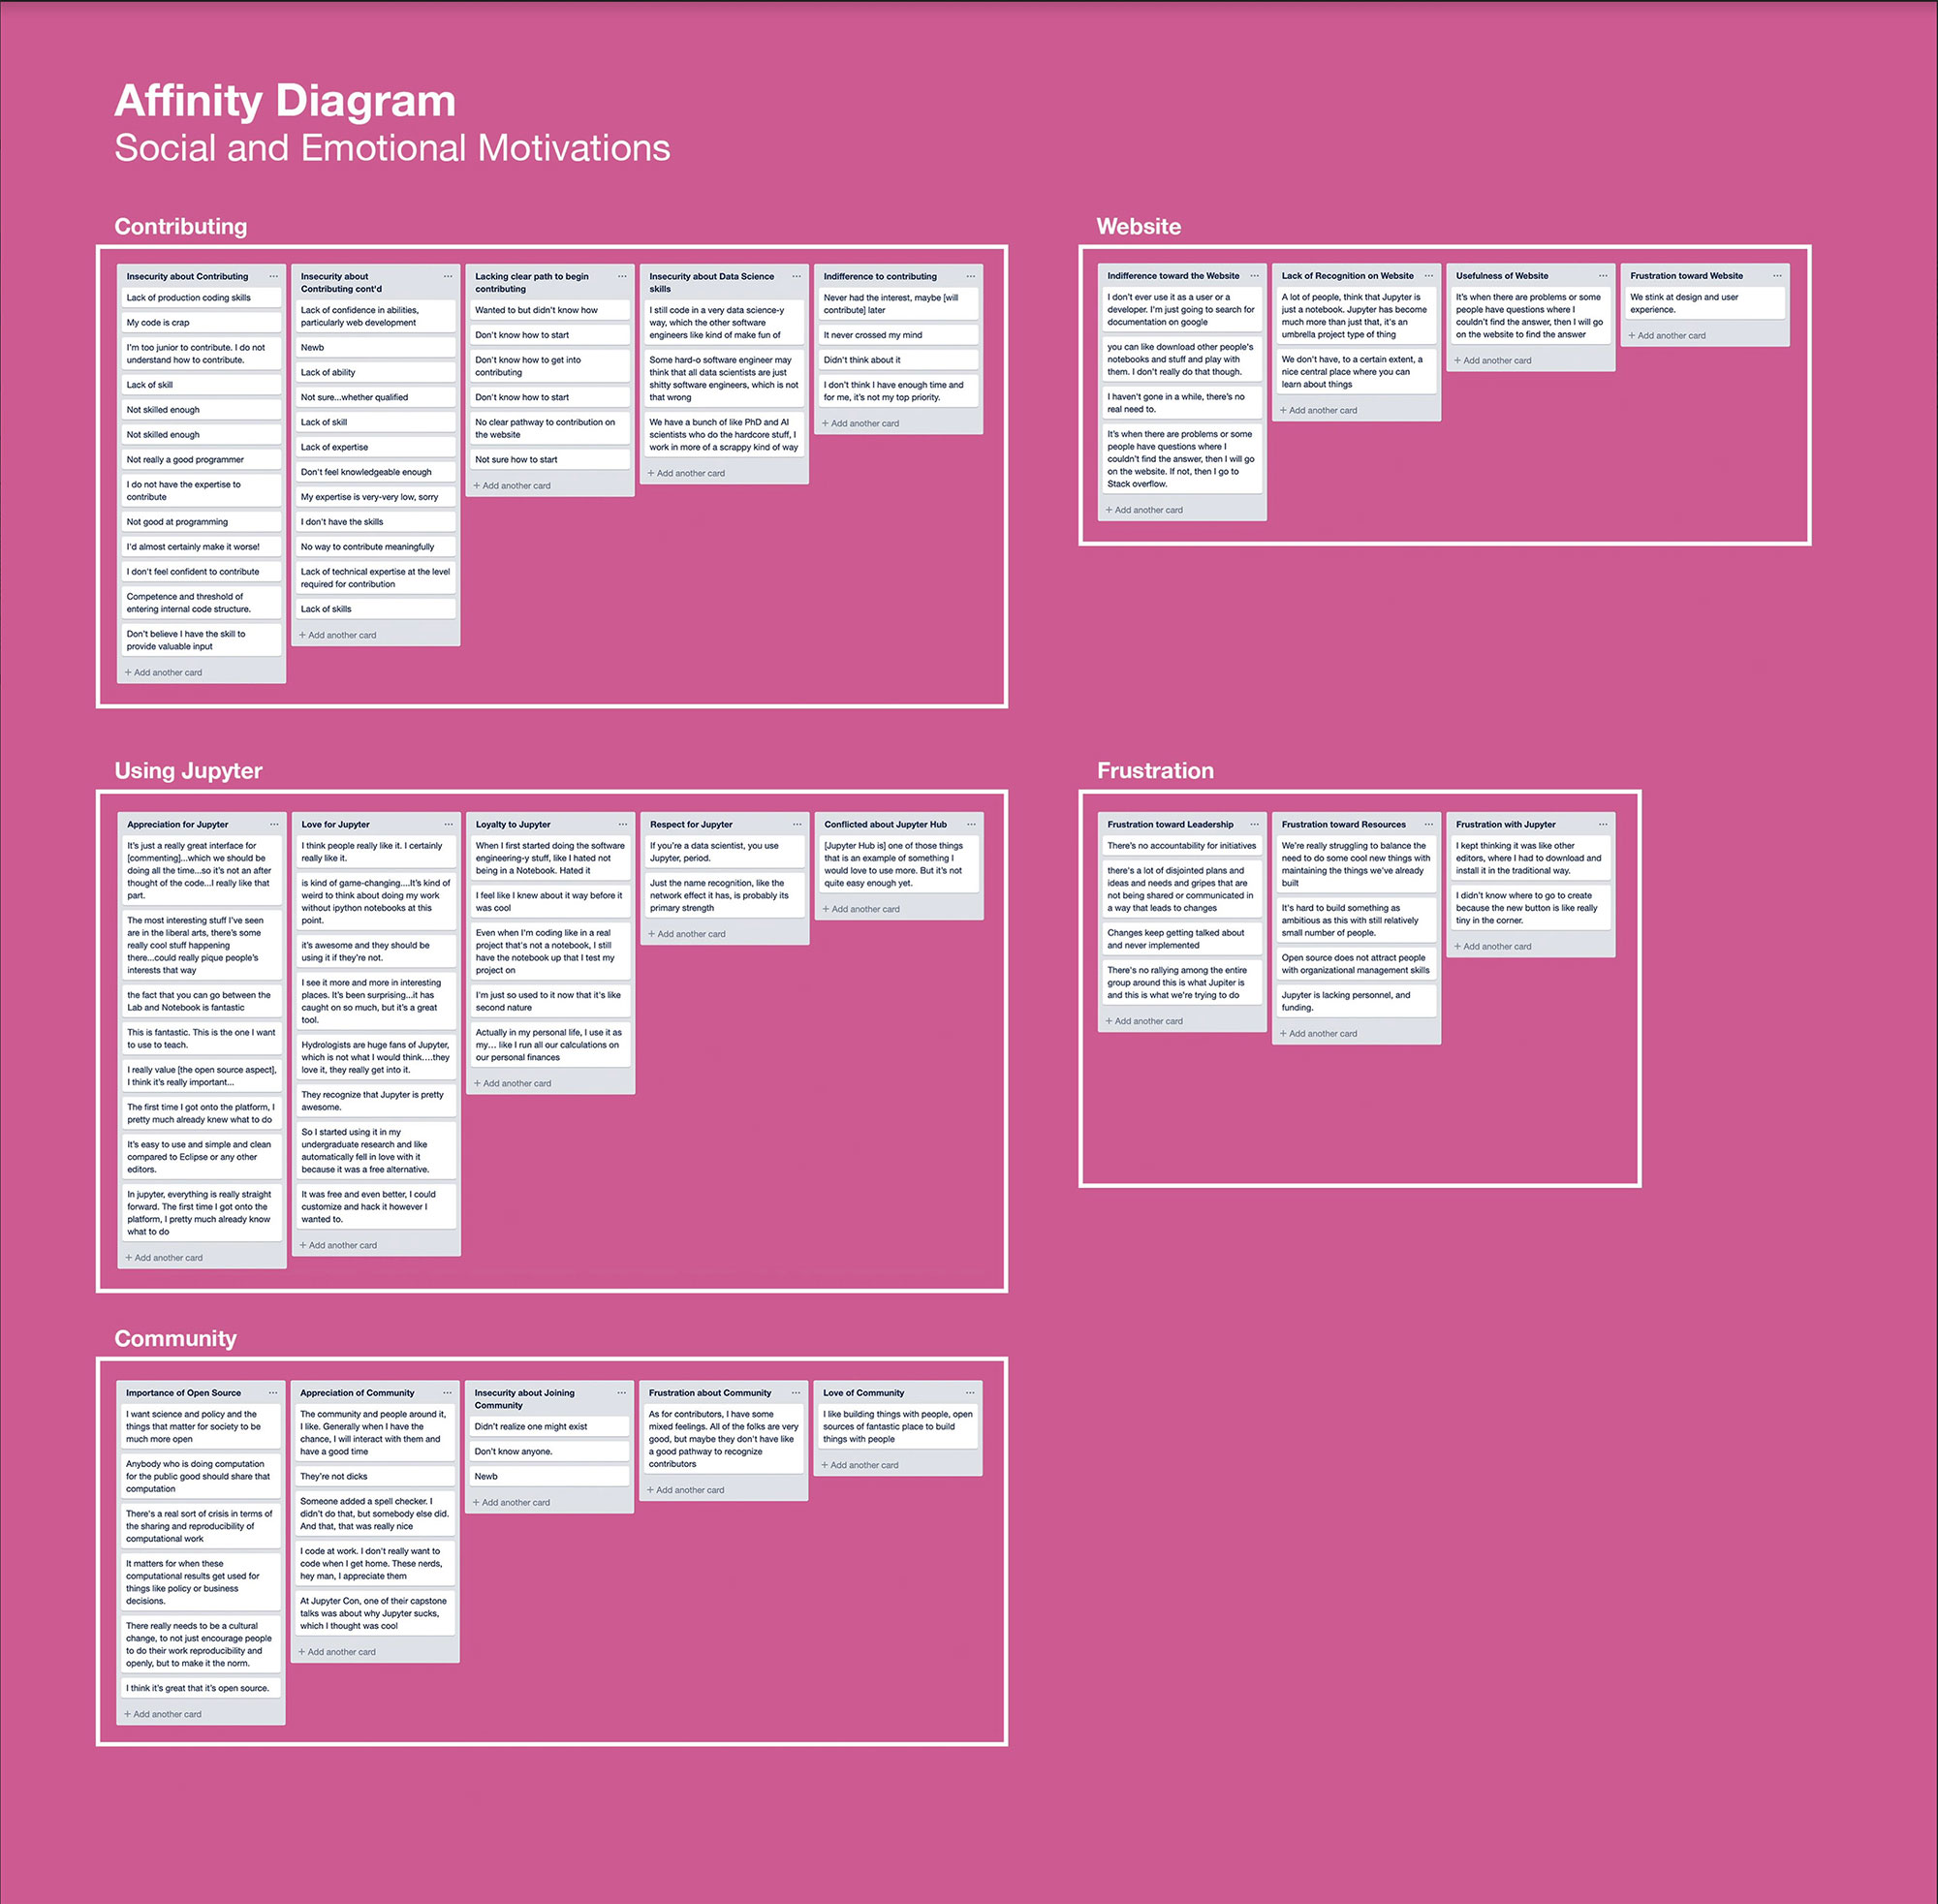
Affinity Diagrams
We combined data obtained from a series of face to face interviews and a survey conducted with community members, stakeholders, and people who never used the product before.
Interviews - Survey - Jobs to Be Done
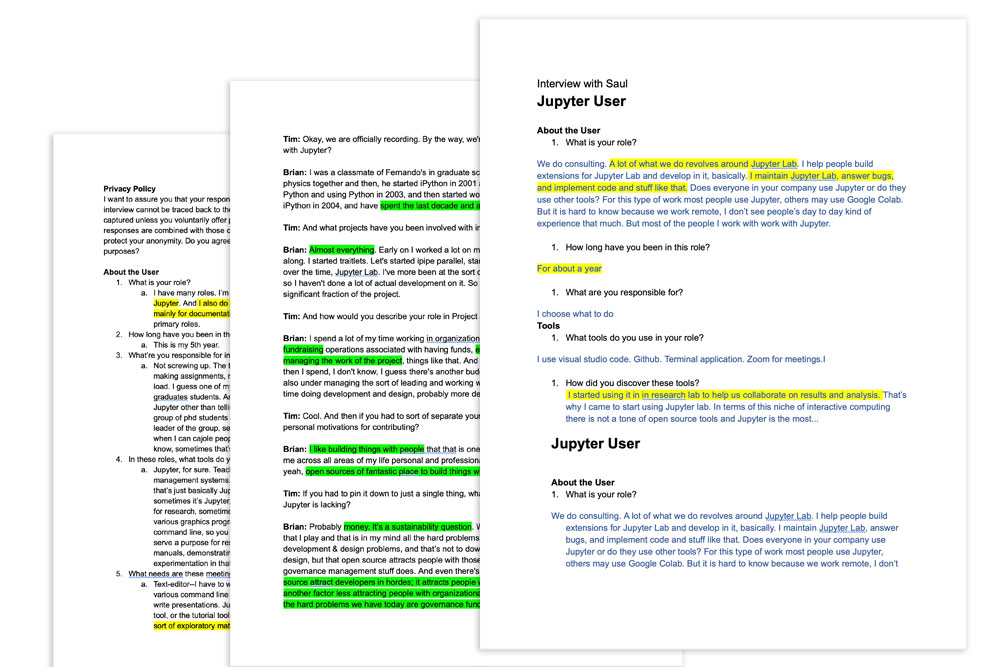
We invited members of the community, sponsors, contributors, and some non users to participate in face-2-face interview. This interviews helped us gain insights about the different needs and problems faced by those trying to use the tools. Specially those without a mathematics or scientific background. From these interviews we learned:
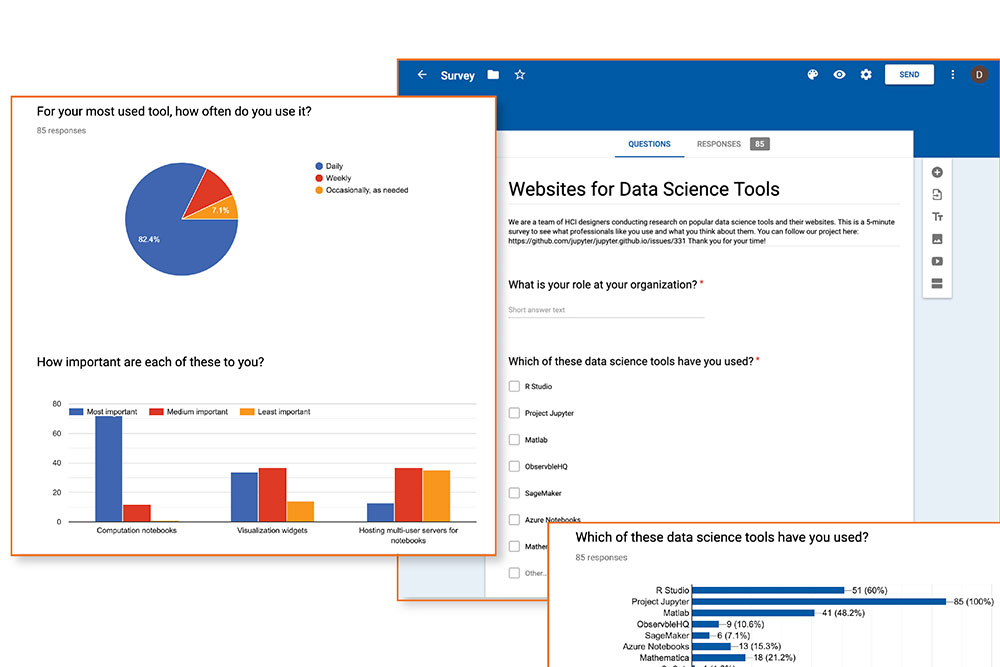
Our survey was promoted on Project Jupyter’s social media accounts, recruiting many of their followers. The results revealed the “community” as the most often visited part of the website yet 27.38% of these followers rarely or never interact with the Jupyter community.
Synthesizing our findings produced the 3 most common Jobs to Be Done.
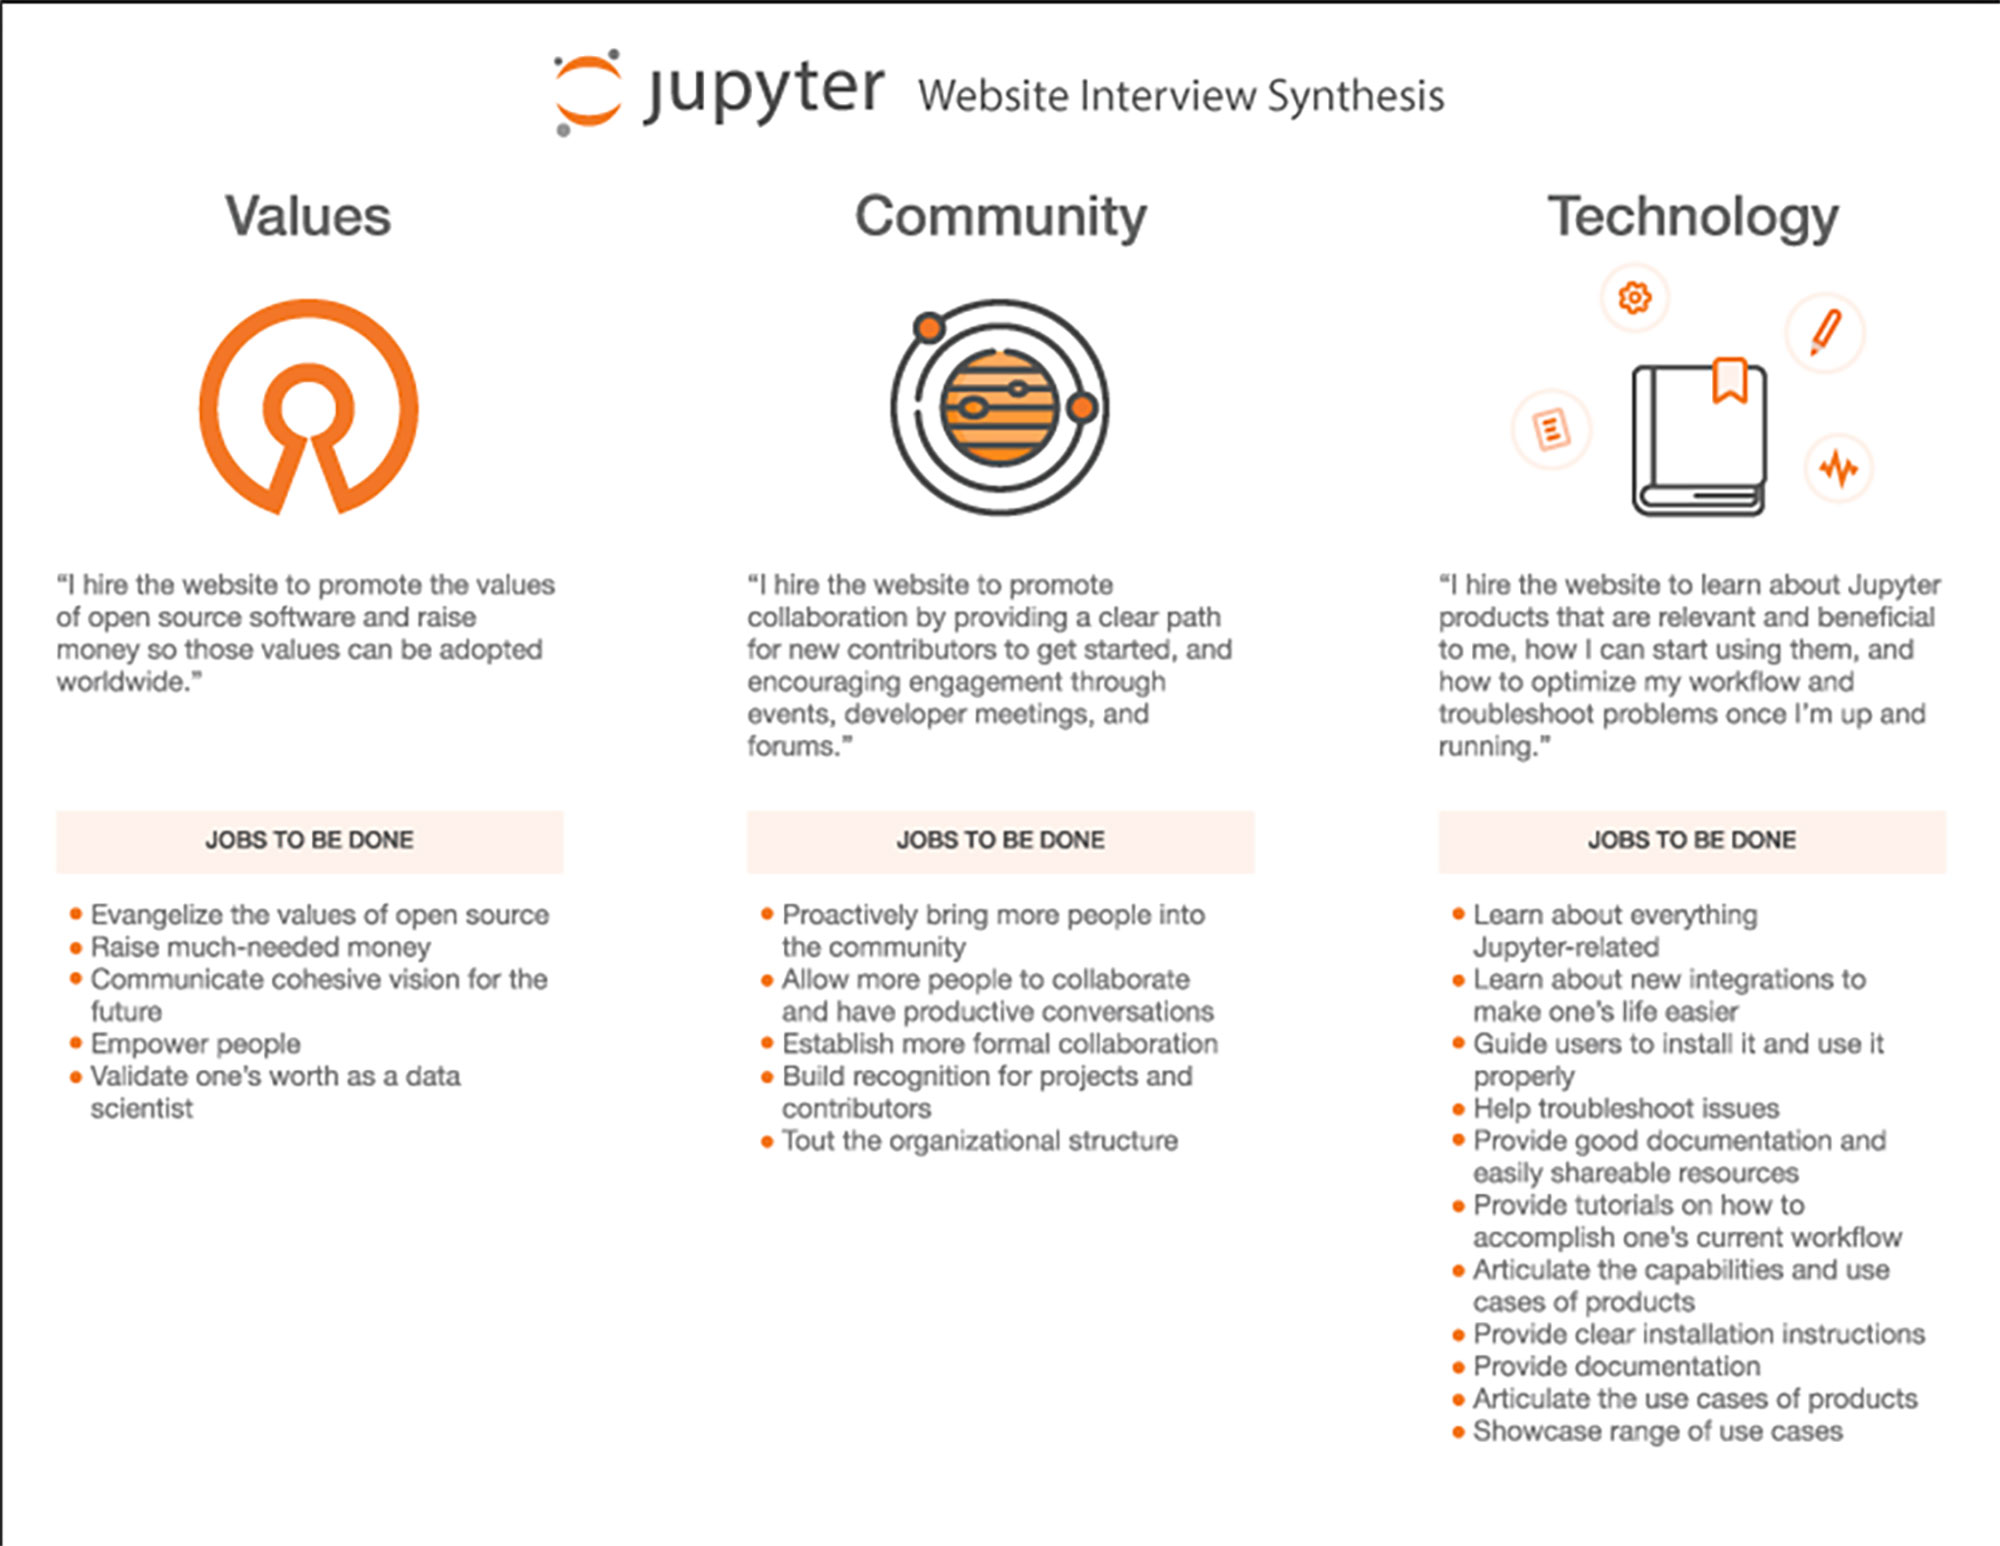
Affinity Diagrams
We created two Affinity Diagrams using insights gathered from our surveys and in-depth interviews with Jupyter users, non-users, contributors, and community members. The diagrams later helped us construct jobs-to-be-done and archetypes. .